Key Highlights
- Housing prices in the United States have consistently risen over the long term, with the average sales price showing significant growth over the past 50 years.
- Home values experienced their fastest increase during the 1970s, with a 43% jump in median home value.
- The national home price index shows that despite recent market cooling, prices remain high, with the average sales price reaching over $522,000 in 2025.
- Key factors influencing home prices include mortgage rates, supply and demand, and broader economic growth.
- Using data-driven platforms like TrueParity can help you find a top real estate agent to navigate these market trends effectively.
Introduction
Have you ever wondered how much home prices have changed over the years? The real estate market in the United States has seen a remarkable journey, with home prices generally trending upwards over time. While there are always short-term fluctuations, the bigger picture shows a steady increase in value. Understanding these long-term trends is crucial, whether you're thinking about selling your home or are just curious about the market. This guide will explore the history of housing prices and what it means for homeowners today.
Key Trends in U.S. Housing Prices Over the Years
Looking back over the last several decades, the average sales price of homes in the U.S. has climbed significantly. From just $42,600 in 1975, the average price skyrocketed, surpassing $500,000 in recent years. This demonstrates a strong, long-term appreciation in home values.
While the overall trend is upward, the journey has included periods of rapid growth and stabilization. The national home price index reflects these changes, capturing the market's response to various economic conditions. Next, we’ll look at these shifts on a decade-by-decade basis and consider how inflation affects our understanding of these prices.
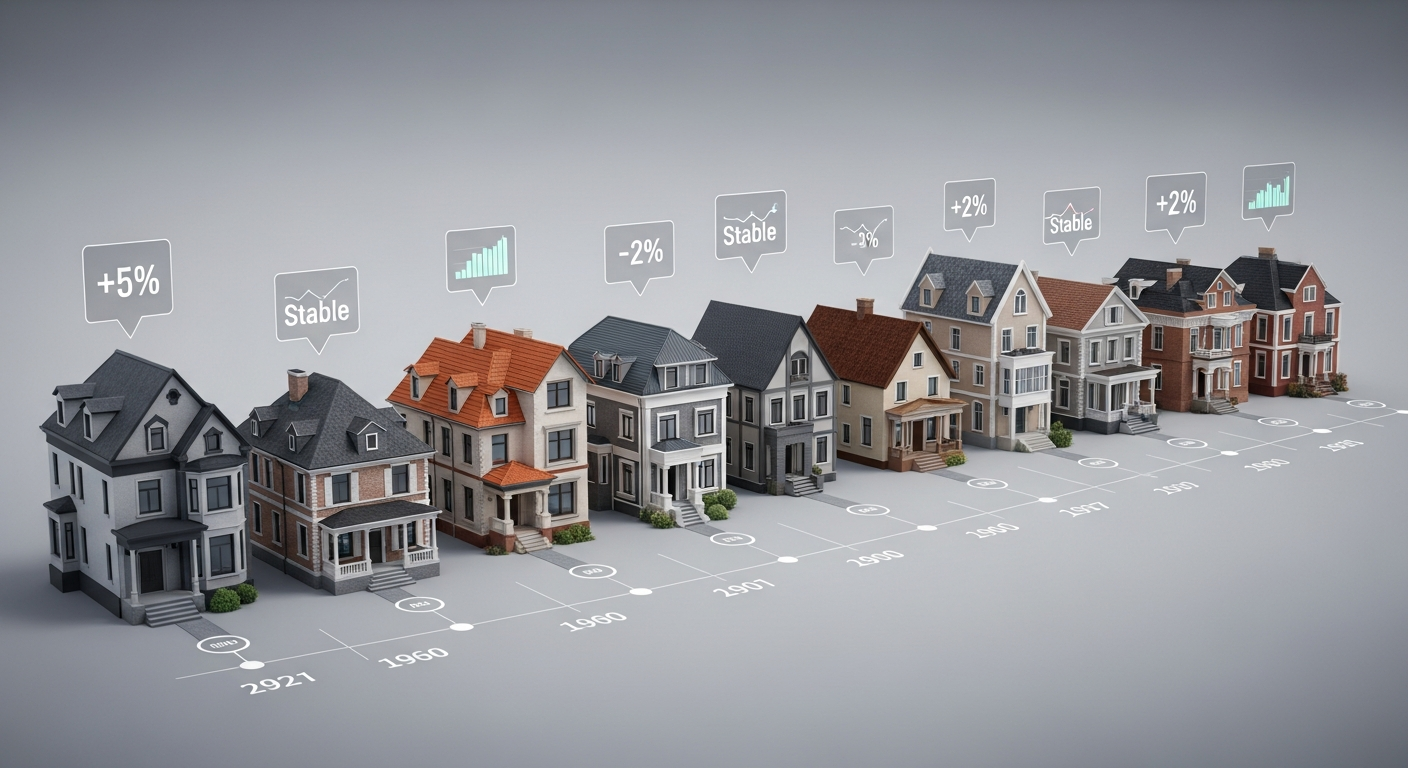
Decade-by-Decade Growth and Fluctuations in Home Values
When you examine home prices decade by decade, you can see a clear pattern of growth. The earlier decades, like the 1970s, saw some of the most dramatic increases, with the median home value jumping by 43%. This period set the stage for future appreciation. The 1980s, in contrast, experienced slower growth, showing that the market doesn't always move at the same pace.
In later decades, the trend continued, though with its own set of fluctuations. The national home price index helps track these movements, showing how the house price in one period compares to another. This historical view is essential for understanding the value of your property in a broader context.
Here's a look at the average house price over time:
Year / Average Sales Price (in U.S. Dollars)
1975
$42,600
1985
$100,800
1995
$158,700
2005
$297,000
2015
$352,700
2025
$522,800
Comparing Nominal vs. Inflation-Adjusted Housing Prices
It's one thing to see the nominal sales price of a house increase over the years, but what does that really mean for your purchasing power? Nominal prices are the face value in dollars at that time. For example, the average sales price of houses went from $26,600 in 1970 to $522,800 in 2025. On the surface, that looks like a massive increase.
However, to get a true sense of growth, it’s important to look at inflation-adjusted prices. When you adjust for inflation, you can see how much home values have grown beyond the general rise in the cost of living. Even after accounting for inflation, the median home value has nearly quadrupled since 1940.
This shows that real estate has historically been a strong investment, outpacing inflation over the long run. The home price index often provides both nominal and inflation-adjusted figures to give a clearer picture of market performance.
Influences and Insights Behind Changing Home Prices
So, what causes these shifts in home prices? Several key factors work together to influence the housing market. Elements like mortgage rates, the total number of home sales, and the pace of new residential sales all play a significant role in determining the median price you see in a graph.
These influences drive the market dynamics that can make selling a home feel complicated. Understanding these drivers can help you make more informed decisions. We will now explore the primary forces behind price increases and see how housing trends relate to the wider economy.
Main Drivers of U.S. Housing Price Increases
The upward trend in home values isn't accidental; it’s driven by a combination of powerful economic and social factors. One of the most significant drivers is the simple principle of supply and demand. When more people want to buy homes than there are available properties, prices naturally go up.
Another major factor is mortgage rates. When rates are low, borrowing money is cheaper, which often encourages more buyers to enter the market, pushing home values higher. Conversely, when rates rise, demand can cool off.
Other key drivers that contribute to rising home prices include:
- Economic Growth: A strong economy often leads to higher wages and more job security, giving people the confidence and means to buy a home.
- Population Growth: A growing population increases the overall demand for housing.
- Neighborhood Trends: Desirable schools, new businesses, and local amenities can make a specific area more attractive, boosting prices.
How Home Price Trends Compare to Broader Economic Factors
Housing prices don't exist in a bubble. They are deeply connected to the health of the overall economy. For instance, the home price index often moves in relation to broader economic growth. During periods of strong economic expansion, you typically see housing prices rise as more people have the financial stability to invest in a home.
Inflation is another critical factor. While housing prices have generally outpaced inflation over the long term, short-term spikes in inflation can impact affordability. Rising costs for goods and services can strain household budgets, making it harder for potential buyers to save for a down payment.
The year-over-year growth of the home price index often reflects these connections. For example, the Freddie Mac House Price Index showed a growth of 6.5 percent in 2023, which was still above the long-term average, indicating a resilient market despite some economic headwinds.
How Real Estate Agents Help You Navigate Shifting Markets
Understanding long-term trends at the national level is helpful, but the real estate market is incredibly local. This is where a skilled real estate agent becomes invaluable. They can interpret what these broad market shifts mean for your specific neighborhood and property, helping you make the best decisions when it comes to home sales.
An expert agent does more than just list your house; they provide crucial insights into pricing, marketing, and negotiation. As we’ll see, working with a top local agent can significantly impact your selling experience and financial outcome, and using data is the best way to find one.
The Value of Working with Top Local Agents When Selling
When you decide to sell your home, your goal is to get the best possible price in a reasonable amount of time. A top real estate agent is your most important partner in achieving this. These professionals have a deep understanding of local market dynamics that data on home sales at a national level simply can't provide. They know what buyers in your area are looking for and how to price your home competitively.
Working with an experienced agent can make a huge difference in your final average sales price. They handle the complex details of the selling process, from marketing your property effectively to negotiating with potential buyers on your behalf.
Here’s where a great agent adds tangible value:
- Expert Pricing Strategy: They analyze recent sales and current competition to set a price that attracts buyers and maximizes your return.
- Skilled Negotiation: A seasoned agent advocates for your interests to secure the best terms and price.
Using TrueParity’s Data Approach to Find the Best Agent for Your Needs
So, how do you find that top agent who can truly make a difference? In a world filled with choices, the best approach is a data-driven one. Instead of relying on a friend's recommendation or a random search, you can use performance data to find an agent who has a proven track record of success in your specific area.
This is where TrueParity comes in. TrueParity is a real estate tech company that takes the guesswork out of finding an agent. It analyzes real performance metrics to identify the top agents who consistently achieve excellent results for their clients, helping them navigate the market and get the best home values.
By using TrueParity, you connect with professionals whose success is proven by data. This ensures you’re partnering with someone who has the expertise to handle the complexities of the real estate market and help you achieve your selling goals.
Conclusion
In conclusion, understanding housing prices over time is crucial for making informed decisions in the real estate market. Trends show that despite fluctuations, housing prices generally increase, influenced by various economic factors. Navigating these shifts can be complex, which is where the expertise of a skilled real estate agent comes into play. By utilizing data-driven tools like TrueParity, you can find the best agents tailored to your specific needs, ensuring you make the most of your buying or selling experience. Don't leave it to chance; leverage the power of data to simplify your journey in the housing market. Explore TrueParity today to get started!
Frequently Asked Questions
Where can I find up-to-date data and charts on U.S. housing prices?
You can find reliable data and graphs on U.S. housing prices from sources like the S&P, CoreLogic, Case-Shiller Home Price Index (often called the Shiller index) and the Federal Reserve Economic Data (FRED). These resources offer detailed tabulations and charts on the national home price index and median home values.
What should I consider when analyzing trends in home values?
When analyzing trends in home values, look beyond the average sales price. Consider the median sales price to avoid skewed results from very high-end sales. Also, use inflation-adjusted figures for a true sense of growth and look at data on new residential sales to understand supply trends.
How might U.S. housing prices trend in 2026?
While forecasts vary, many experts predict that housing price trends in the United States at the national level may see modest growth into 2026. Factors like mortgage rates and housing supply will continue to influence the home price index and the average sales price across the country.